FX-controller programming - PID/control/setpoint#
Getting started part 3: FX-Points - PID/control/setpoint#
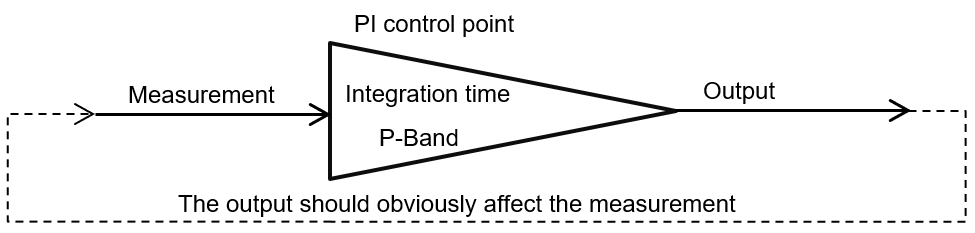
PID or Control Points (set points)#
Control Points have an embedded PID-regulator with up to 6 output stages. The stages are always used cumulatively, meaning that the 0-100% output from the main PID is distributed over the different stages, where the first output stage needs to be at maximum value before the second stage will receive any value. Similarly, the second stage needs to be at max value before the third stage is activated etc. The distribution over the different stages is based on the entered P-band values.
NOTE: In the parametrising of the PID point, the P-Band is the opposite of the mathematical proportional term. This means bigger P-Band values will slow down the PID, whereas smaller P-Band values will speed up the PID.
NOTE: Because of the nature of the processes we encounter in building automation, no derivative term is commonly being used. The lack of derivative action makes the system steadier in the steady state when having noisy input data (like an NTC10 temperature sensor). Without derivative action, a PI-controlled system is less responsive to real (non-noise) and relatively fast alterations in state. This however also means the system might be a little bit slower to reach the setpoint and a little bit slower to respond to unexpected perturbations than a well-tuned PID system could be.
The basic principle of a control point is very straight forward: define a measurement, select the number of output stages and select the AO-points to send the output of each stage to.
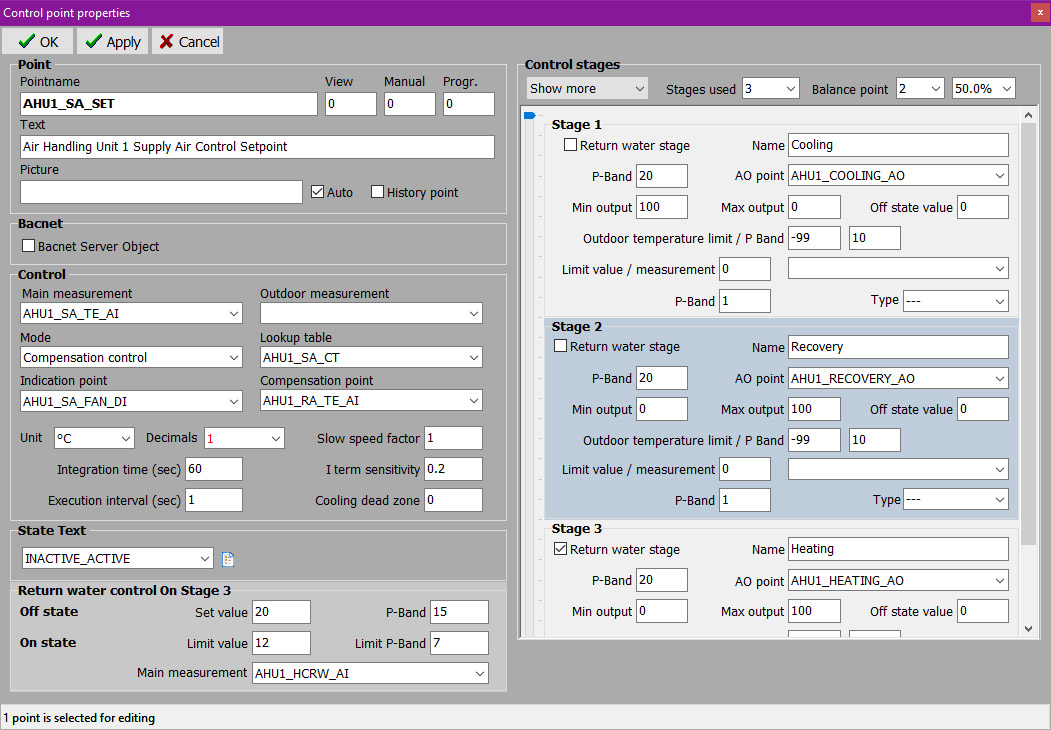
As mentioned, a Fidelix control point can have up to six output stages, and the point’s 0-100% output is divided over these outputs based on the entered P-Band values. Let’s take an example where we use three output stages (cooling, recovery and heating), and the stages have P-Band 15, 25 and 20.
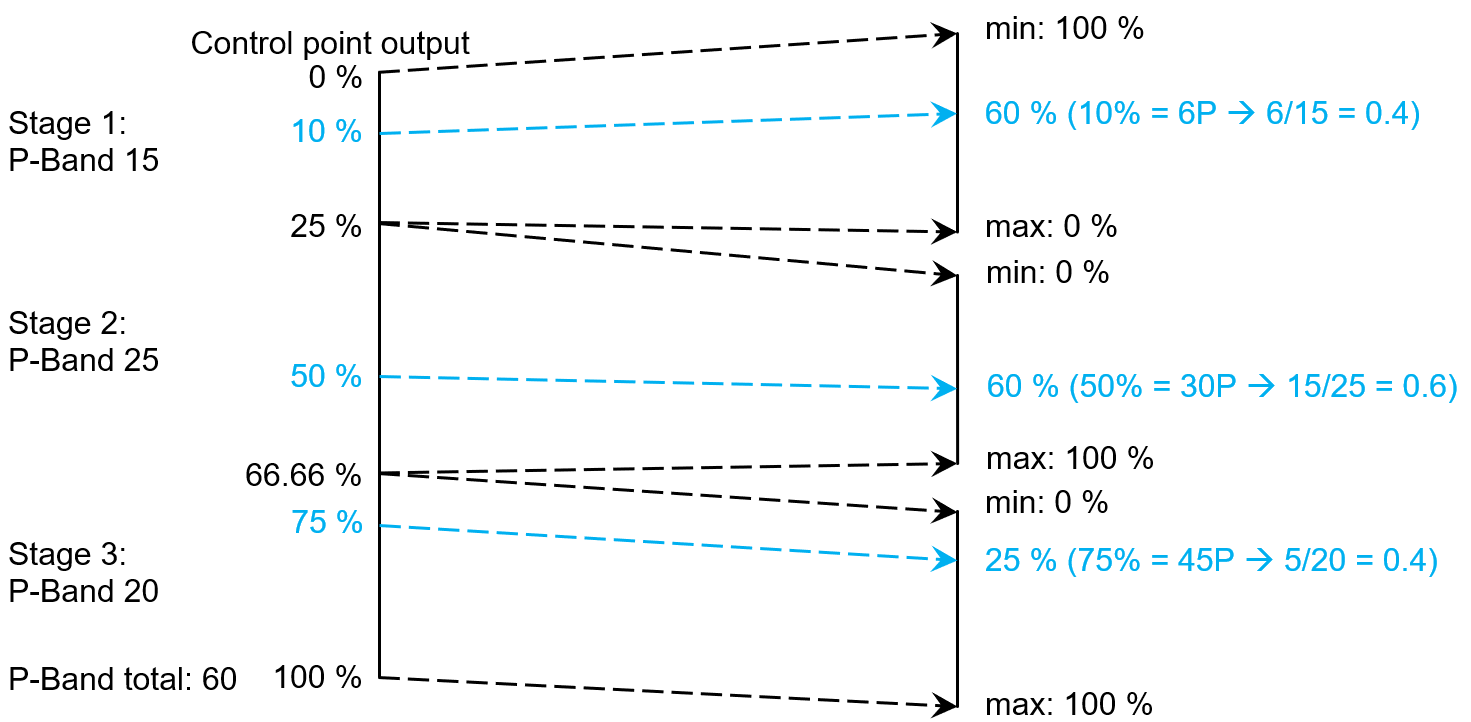
NOTE: When the cooling dead zone parameter is not used, the setpoints is always in “heating mode”, meaning that to cool, the cooling stages always come first, and will have 100 as minimum output, 0 as maximum output.
In the example the setpoint for the supply air is calculated based on the return air temperature (Compensation point AHU1_RA_TE_AI) using a conversion table (Lookup table AHU1_SA_CT).
Another possibility is using a cascade control (a second control point) or a constant set value.
The PI calculation is only active when the supply air fan runs (Indication point AHU1_SA_FAN_DI), otherwise the “Off state values” defined in each stage, are sent to the respective AO points.
At this point it is good to repeat that the behaviour of the P-band is reversed on a Fidelix controller. This means that bigger P-Band values will slow down the PID, whereas smaller P-Band values will speed up the PID !
- A good rule of thumb to calculate the values to enter is:
Fidelix P-Band = calculated P-band * 1.2 Fidelix I-Term = calculated I-Term * 3.3
Verify your skills:#
How do you change the P-Band parameter on the Fidelix Control Point to make the control react faster ?
> Remember the behaviour of the P-band is reversed
[ ] Increase the value
[ ] Don’t touch the P-band value at all. Instead, change the integral parameter
[x] Decrease the value
FX-Points#
All FX-points-related manipulations and parameters can be done directly on the FX-controller through the normal user interface on the screen or through your browser.
The points and their parameters are stored in files inside the HDiskFidelixDATA folder.
Under normal circumstances however, we use FX-Editor to create, edit and parametrise FX-points, and then upload the necessary files to the FX when this is done on your local computer. This makes the point programming faster, easier, and especially gives you easy backups of your projects.
At any point in time you are always still able to make changes directly on the FX, and read those back in to your FX-Editor project.
To use the Fidelix FX-Editor, you need a license key. This key can be obtained by following the steps described in this knowledge base article.
When you include the HTML pages you created in the graphics editor in your FX-Editor project, it will detect all the points you used on the graphics and list them on the “Points” tab in FX-Editor. Simply run the points through a filter to include them in your project, or create the points manually and upload them to your FX.
Analogue measurements Using a classic AI-8 or COMBI-36 module:
Select the type of sensor (resistive, 0-10V, 4-20mA) by setting the jumpers accordingly as marked on the PCB of the module. In the point programming of your measurement point, you have to select a conversion table to interpret the measured values correctly, and convert them into usable values. Each measurement point that is connected to a module, returns a value from 0 to 100 000 (which is in its turn the converted value read from the module’s registers).
For voltage measurement, these values are linearly linked to 0-10 V, meaning that 0=0V and 100 000=10V.
For resistive measurements, following formula should be applied: R = (4700 x FXvalue) / (100 000 - FXvalue).
For current measurements: I = FXvalue / 4 000 000.
This means that when you read a current emitting sensor, your conversion table should interpret values from 16 000 to 80 000 (as opposed to 0 to 100 000 for voltage measuring) as current measured from 4 to 20 mA.
Analogue measurements Using an FdxCompact AI-8-C module or the internal I/O’s of an FX-SPIDER controller:
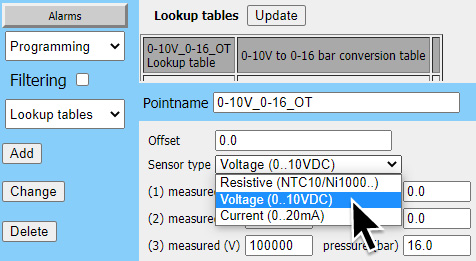
The type of sensor is selected in the Conversion Table (Lookup Table) you select for your measurement point.
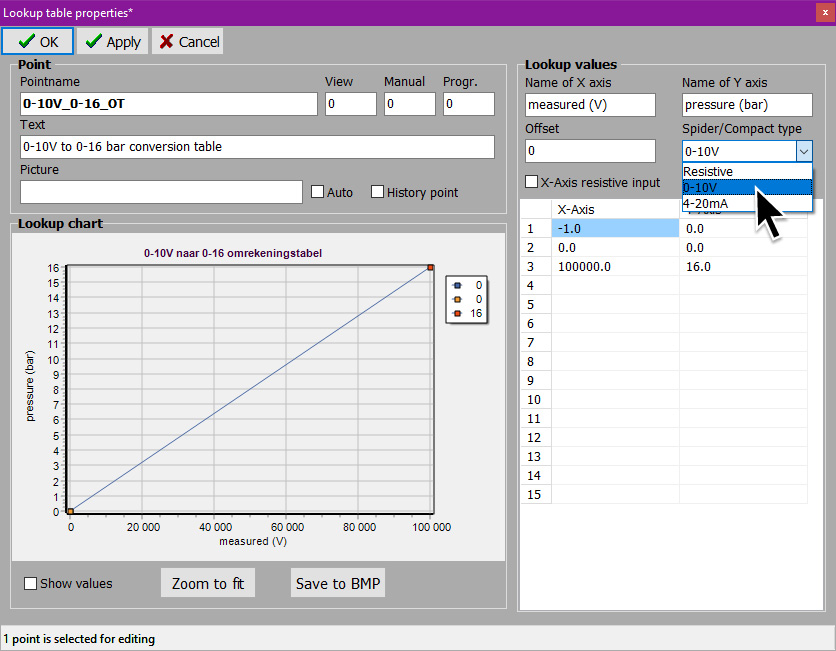
For voltage and resistive measurements, the same values are returned as when using external modules, meaning 0-10V is expressed linearly from 0 to 100 000, and resistance can be calculated from the raw value the module returns using following formula: R = (4700 x FXvalue) / (100 000 - FXvalue).
To use current emitting sensors (0..20 mA), select the correct type of conversion table. Using the Spider, an additional resistance needs to be connected to the same input (C1-D8) between the ground (I1-J8) and the measurement point your sensor is connected to. In this setup, the Spider measures the voltage drop over the resistor, caused by the current the sensor is emitting. To get the highest possible accuracy, we recommend using a 205Ω resistance.
For both the FdxCompact AI-8-C module where current emiting sensor are directly connected, and the Spider, using the edditonal resistor, use following values to convert the current measurement:

- Would you however not have this 205Ω resistor available, you can also use a resistor with a different impedance and recalculate the measured values to be used in your conversion table (Lookup Table) as follows:
(Your resistor / 205 Ω) * 4 mA * 2 000 000 = FXvalue (Your resistor / 205 Ω) * 20 mA * 2 000 000 = FXvalue
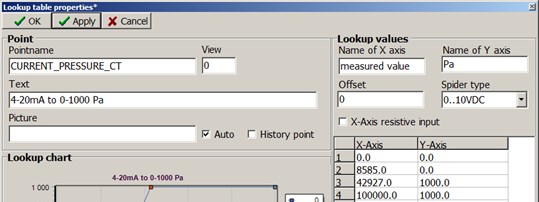
- This means that for a 220 Ω resistor, following lookup table should be used:
(220 / 205) * 0.004 * 2 000 000 = 8 585 (so 4mA = 8 585 as the read value, or X-Axis value) (220 / 205) * 0.020 * 2 000 000 = 42 927 (so 20mA = 42 927 as the read value, or X-Axis value)
NOTE: Even though you can theoretically use resistors up to 512.5 Ω to measure 20 mA (500 / 205 * 0.02 * 2 000 000 = 100 000, which is the maximum value a measurement can return), the curve will no longer be linear if the current is over 10 mA. This is because certain components on the Spider’s IO-board will start conducting at voltage levels above 5V. So, when selecting your resistor, 250 Ω should really be the biggest one used.